
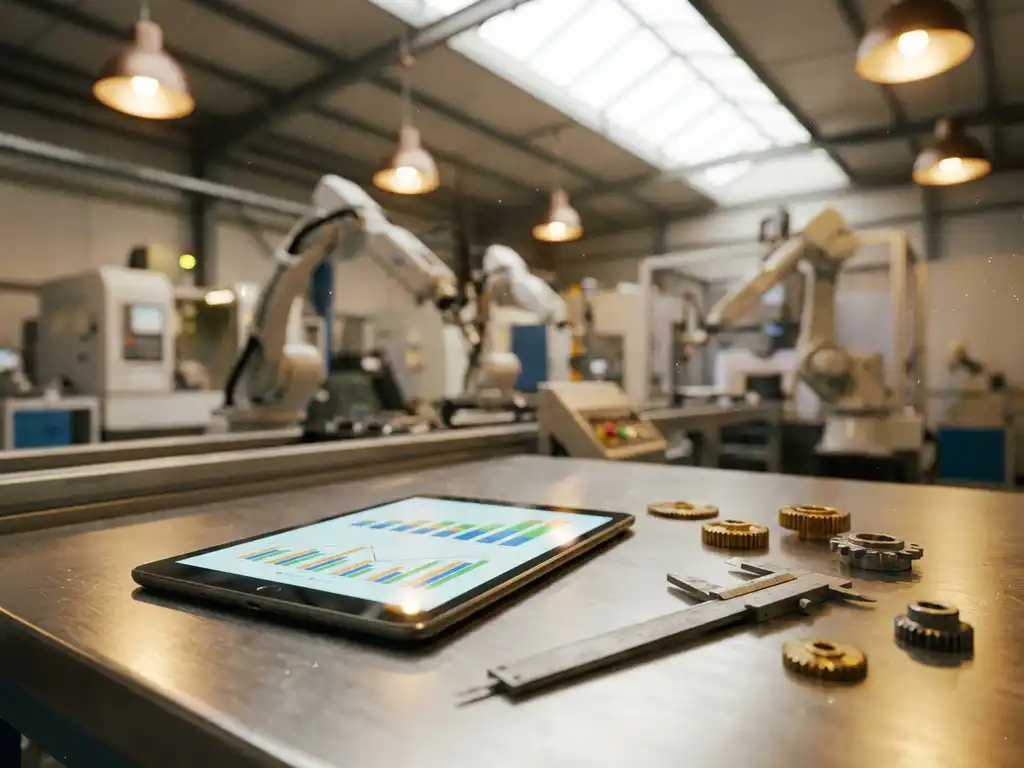
Measuring production efficiency improvements requires tracking specific key performance indicators that provide clear visibility into manufacturing performance. Overall Equipment Effectiveness (OEE), throughput rates, cycle times, quality metrics, and resource utilisation ratios form the foundation of comprehensive efficiency measurement. These metrics help organisations identify bottlenecks, optimise resource allocation, and demonstrate tangible improvements in manufacturing operations, while supporting end-to-end supply chain optimisation strategies.
What are the most important KPIs for measuring production efficiency?
The most critical KPIs for production efficiency include Overall Equipment Effectiveness (OEE), throughput rates, cycle times, first-pass yield, and resource utilisation ratios. These metrics provide comprehensive visibility into equipment performance, production speed, quality outcomes, and resource deployment across manufacturing operations.
OEE is the gold standard for manufacturing measurement, combining availability, performance, and quality into a single percentage that reflects true productive capacity. Throughput rates measure actual output against planned production, while cycle times track how long individual processes take from start to finish.
Quality metrics such as first-pass yield, defect rates, and rework percentages reveal how efficiently production processes create acceptable products. Resource utilisation ratios examine labour efficiency, machine capacity usage, and material consumption patterns. Together, these KPIs create a comprehensive picture of manufacturing performance that supports supply chain bottleneck analysis and identifies specific areas requiring improvement across the industries we serve.
Energy consumption per unit, changeover times, and setup efficiency also serve as valuable secondary metrics. These indicators help manufacturers understand the total cost of production while identifying opportunities for logistics optimisation techniques that reduce waste and improve overall operational efficiency.
How do you calculate overall equipment effectiveness and why does it matter?
OEE is calculated by multiplying three components: Availability (planned production time minus downtime), Performance (actual cycle time versus ideal cycle time), and Quality (good units produced versus total units produced). The formula is OEE = Availability × Performance × Quality, typically expressed as a percentage.
Availability measures the percentage of scheduled time that equipment actually operates. Calculate this by dividing actual operating time by planned production time. For example, if equipment runs for 420 minutes during a planned 480-minute shift, availability equals 87.5%.
Performance compares actual production speed with the theoretical maximum speed. This component reveals whether equipment operates at an optimal pace or experiences minor stops and slow cycles. Quality measures the percentage of produced units that meet specifications without requiring rework or resulting in scrap.
OEE matters because it provides a standardised benchmark for comparing equipment performance across different lines, shifts, and facilities. World-class manufacturing typically achieves OEE scores above 85%, while average performance ranges between 60% and 70%. This metric enables data-driven decisions about maintenance schedules, operator training needs, and equipment replacement priorities.
Understanding the OEE components helps identify whether efficiency losses stem from equipment breakdowns, speed reductions, or quality issues. This granular insight supports targeted improvement initiatives and helps organisations prioritise investments in maintenance, training, or process modifications that address the challenges we solve for manufacturing clients.
What’s the difference between efficiency metrics and productivity measurements?
Efficiency metrics measure how well resources are used to achieve outputs (doing things right), while productivity measurements focus on the ratio of outputs to inputs (doing the right things). Efficiency emphasises optimal resource utilisation, whereas productivity emphasises output maximisation relative to resource investment.
Efficiency metrics examine waste reduction and resource optimisation within existing processes. These include equipment utilisation rates, energy consumption per unit, material yield percentages, and labour efficiency ratios. Efficiency improvements typically involve eliminating bottlenecks, reducing setup times, and minimising defects.
Productivity measurements compare total output against total inputs, including labour hours, machine time, raw materials, and energy consumption. Productivity can increase through higher output volumes, reduced input requirements, or improved output quality that commands premium pricing.
The distinction matters for decision-making because efficiency improvements often require process optimisation and waste elimination, while productivity gains might involve capacity expansion, automation investments, or product-mix changes. Efficiency metrics guide operational improvements, whereas productivity measurements inform strategic decisions about resource allocation and capacity planning.
Both types of metrics complement each other in comprehensive performance management. High efficiency without productivity growth might indicate optimised current processes but limited scaling potential. High productivity with low efficiency might suggest unsustainable resource consumption that threatens long-term competitiveness.
How do you track production efficiency improvements over time?
Tracking production efficiency improvements requires establishing baseline measurements, setting specific improvement targets, implementing continuous monitoring systems, and creating regular reporting frameworks that demonstrate progress and identify new optimisation opportunities.
Start by collecting historical data for key efficiency metrics over a representative period, typically 3 to 6 months, to establish reliable baselines. Document current OEE scores, cycle times, quality rates, and resource utilisation levels across different products, shifts, and equipment lines. This baseline data provides the foundation for measuring future improvements.
Set specific, measurable targets for each efficiency metric based on industry benchmarks and internal capabilities. Effective targets might include improving OEE from 72% to 80% within six months, reducing setup times by 25%, or increasing first-pass yield from 94% to 97%. Clear targets enable focused improvement efforts and meaningful progress evaluation.
Implement real-time monitoring systems that capture efficiency data continuously rather than relying on periodic manual measurements. Modern manufacturing execution systems automatically collect machine data, track production counts, and calculate efficiency metrics in real time. This continuous monitoring enables rapid response to efficiency declines and validates improvement initiatives immediately.
Create regular reporting frameworks that present efficiency trends, highlight achievements, and identify emerging issues. Weekly operational reviews, monthly management dashboards, and quarterly improvement assessments help maintain focus on efficiency goals while supporting data-driven decision-making across the organisation.
Which tools and technologies help measure manufacturing performance effectively?
Manufacturing Execution Systems (MES), real-time monitoring solutions, data analytics platforms, and IoT sensors provide comprehensive capabilities for measuring manufacturing performance. These technologies enable accurate data collection, automated calculations, and actionable insights for continuous improvement initiatives through what we do in manufacturing optimisation.
MES platforms serve as the central hub for production data, automatically capturing machine states, production counts, quality results, and resource consumption. These systems calculate OEE in real time, track performance against targets, and provide detailed reporting capabilities that support both operational and strategic decision-making.
IoT sensors and connected equipment provide granular visibility into machine performance, environmental conditions, and process parameters. Temperature sensors, vibration monitors, pressure gauges, and flow meters generate continuous data streams that reveal performance patterns and predict potential issues before they affect efficiency.
Data analytics platforms process manufacturing data to identify trends, correlations, and optimisation opportunities that might not be apparent through traditional reporting. Advanced analytics can predict equipment failures, optimise maintenance schedules, and recommend process adjustments based on historical performance patterns.
Cloud-based monitoring solutions enable remote access to production data, supporting distributed manufacturing operations and enabling expert support regardless of location. These platforms often include mobile applications that provide real-time alerts and enable an immediate response to efficiency issues. Integration capabilities ensure seamless data flow between different systems, creating comprehensive visibility across the entire manufacturing ecosystem.
How do you identify the root causes behind efficiency improvements or declines?
Identifying root causes requires systematic analysis of efficiency data using statistical techniques, process mapping, and structured investigation methodologies. Effective root cause analysis examines correlations between efficiency changes and operational variables, equipment conditions, and process modifications.
Start with data analysis to identify when efficiency changes occurred and which metrics were most affected. Statistical analysis can reveal correlations between efficiency variations and factors such as operator shifts, material batches, equipment maintenance activities, or environmental conditions. This data-driven approach focuses investigation efforts on the most likely contributing factors.
Process mapping and value stream analysis help visualise how changes in specific process steps affect overall efficiency. Document current processes in detail, then compare them with historical configurations to identify modifications that coincided with efficiency changes. This systematic approach often reveals subtle process variations that significantly affect performance.
Implement structured investigation methodologies such as the “Five Whys” technique or fishbone diagrams to explore potential causes systematically. These approaches prevent premature conclusions and ensure comprehensive evaluation of equipment, materials, methods, measurements, environment, and people factors that might influence efficiency.
Validate root cause hypotheses through controlled testing or pilot implementations. If analysis suggests that specific equipment settings, material specifications, or process parameters caused efficiency changes, test these theories under controlled conditions before implementing broader changes. This validation approach ensures that improvement initiatives address actual causes rather than perceived issues, supporting sustainable efficiency gains across manufacturing operations.
How qinnip helps with measuring production efficiency improvements
qinnip provides a comprehensive solution for measuring and tracking production efficiency improvements across your entire manufacturing operation. Our platform eliminates the complexity of manual data collection and fragmented monitoring systems by delivering:
• Real-time OEE calculations and efficiency metrics automatically captured from your equipment
• Integrated dashboards that track performance trends and highlight improvement opportunities
• Advanced analytics that identify root causes behind efficiency changes and predict potential issues
• Customisable reporting frameworks that demonstrate ROI from your improvement initiatives
• Mobile access for immediate response to efficiency alerts and operational decisions
Transform your production efficiency measurement from reactive reporting to proactive optimisation. Schedule a demo with qinnip today to see how our platform can streamline your efficiency tracking and accelerate your continuous improvement results. Learn more about who we are and how to reach us to discuss your specific manufacturing efficiency requirements.